Generic selectors
Exact matches only
Search in title
Search in content
Post Type Selectors

TOP SEARCHES

Stocks popular

Crypto

Currencies

CFD

Support

OIL – Technical Analysis – 4h

February 16, 2026 17:01

Quick Summary

This chart provides a comprehensive analysis of the asset’s current technical state. The recent price movements indicate a dominant market trend.

The asset is showing signs of potential shifts in momentum, requiring close observation for any changes in direction.

Candlestick Analysis

The overall trend appears to be sideways to slightly bearish, with recent downward momentum in price.

There is a potential bearish engulfing pattern followed by a series of red candles, indicating selling pressure.

The presence of long wicks suggests some buying interest but not enough to reverse the trend.

MACD Analysis

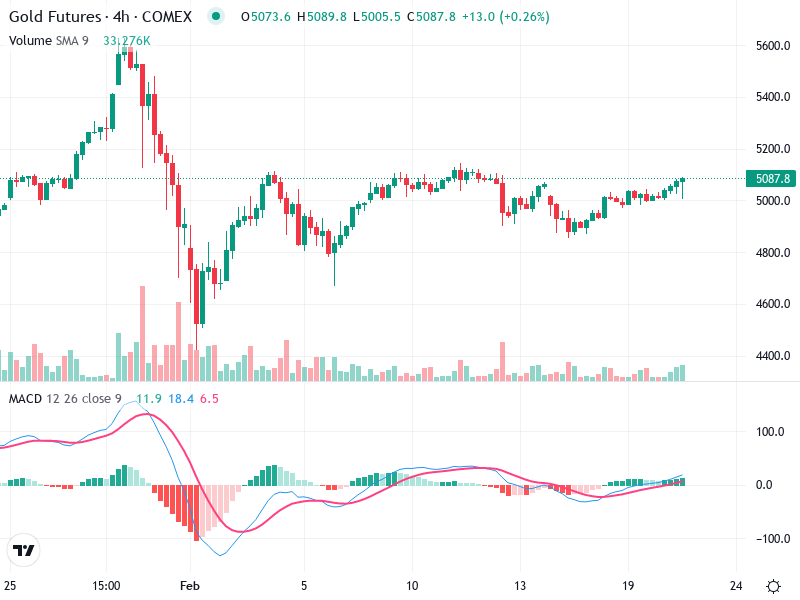
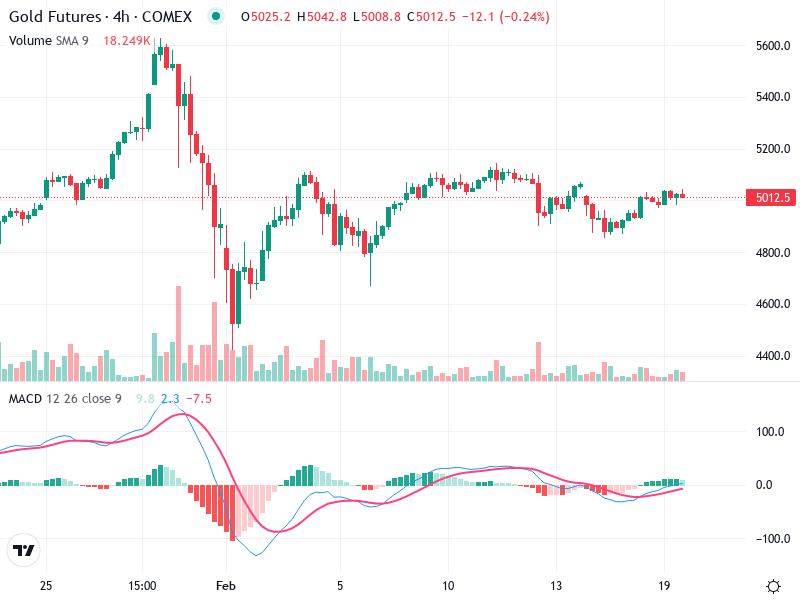
The MACD line is below the Signal line, indicating bearish momentum. However, both are relatively close, suggesting potential consolidation.

The histogram is negative and showing small bars, which suggest weakening bearish momentum. Watch for any changes that could signal a shift.

No significant divergences are observed between MACD and price action; both are aligned downward.

Volume Analysis

There have been consistent volume spikes during price declines, supporting bearish movements.

Spikes in volume, especially on down days, could indicate institutional selling.

Volume supports the current price decline, aligning with the bearish trend.

Support & Resistance

Key support is observed at $62. A break below this could lead to further downside.

Near-term resistance at $65, which needs to be broken for any potential bullish reversal.

Watching these levels will be crucial for assessing future price movements.

Actionable Insights

Given the bearish trend and volume confirmation, a cautious approach is advised. Consider a sell or hold strategy unless there are signs of reversal.

Look for confirmation signals such as a bullish crossover in the MACD or increased buying volume for any potential upside.

Watch for a break below $62 as it may trigger further selling pressure.

The AI Technical Analysis Center is an informational tool only and does not constitute investment or trading advice.
This site is registered on wpml.org as a development site. Switch to a production site key to remove this banner.