February 13, 2026 17:03
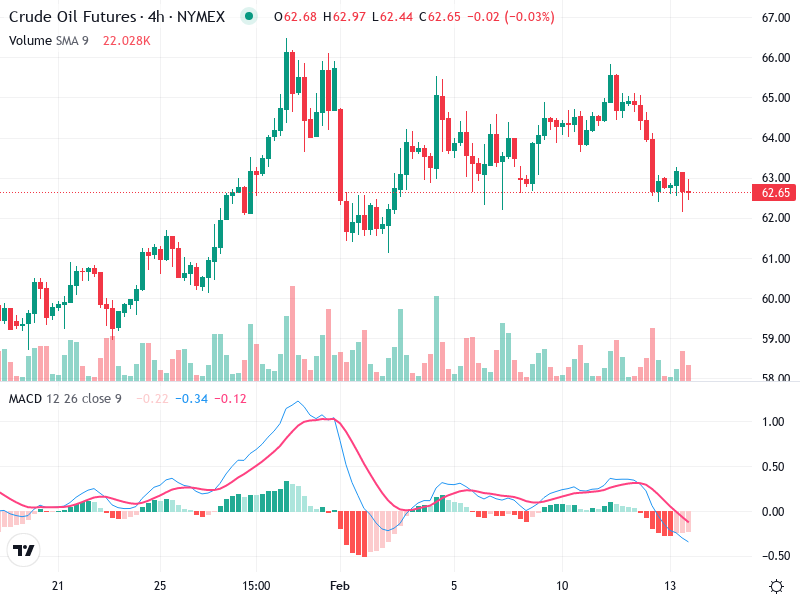
The chart of Crude Oil Futures shows recent market movements. A notable shift in trend dynamics is present, reflecting potential changes in trading strategies.
Overall, the analysis suggests a close watch on key levels for future trading decisions.
The chart shows a recent bullish trend that has reversed to a bearish pullback.
A Bullish Engulfing pattern was seen earlier in the uptrend, helping to propel prices upward.
Recent strong red candles indicate a potential reversal from the peak, with breakout occurring around the $64 mark and a pullback near $62.
The MACD line is below the Signal line, which suggests bearish momentum.
The MACD Histogram is negative and increasing in magnitude, indicating growing bearish momentum.
No significant divergence is observed; the MACD aligns with the price drop.
There is a notable increase in volume during the peak and subsequent drop, indicating strong selling pressure.
The volume spikes suggest possible institutional involvement in the selling phase.
The high volume supports the price decrease, validating bearish sentiment.
Resistance is around $66, a recent peak where selling pressure increased.
Support is near $60, observed as a prior consolidation area, serving as a potential rebound point.
These levels are crucial for understanding potential market moves.
Consider a sell strategy if the price continues to drop below $60 with sustained volume.
Watch for a reversal signal or support confirmation around the $60 level.
Look for any bullish candlestick reversal patterns or a MACD crossover signaling potential buying opportunities.