Generic selectors
Exact matches only
Search in title
Search in content
Post Type Selectors

TOP SEARCHES

Stocks popular

Crypto

Currencies

CFD

Support

NSDQ – Technical Analysis – 4h

February 16, 2026 08:02

Quick Summary

The current technical analysis of the asset shows a bearish sentiment prevailing in the market. Lower highs and lower lows characterize the trend, indicating a challenging environment for bullish movements. The asset has faced resistance when attempting to break key levels, pointing towards sustained market pressure.

However, certain levels of support appear to be holding firm, which could offer potential bounce opportunities if market conditions shift.

Candlestick Analysis

The overall trend appears bearish in the short term, with a sequence of lower highs and lower lows.

A key pattern is the recent attempt at a bullish move that quickly turned into a bearish engulfing, suggesting strong resistance.

The price recently attempted to break above 25,000 but faced resistance. A new support appears to be forming around 24,500.

MACD Analysis

The MACD line is below the Signal line, indicating a bearish crossover in the recent past.

Negative histogram values suggest decreasing downward momentum but remaining in bearish territory.

No clear divergences currently, though the MACD is indicating continued bearish pressure with fading momentum.

Volume Analysis

There is a notable spike in volume during price drops, suggesting selling pressure.

Increasing volume on bearish candles reinforces the downward trend.

An earlier substantial increase in volume could indicate institutional selling.

Support & Resistance

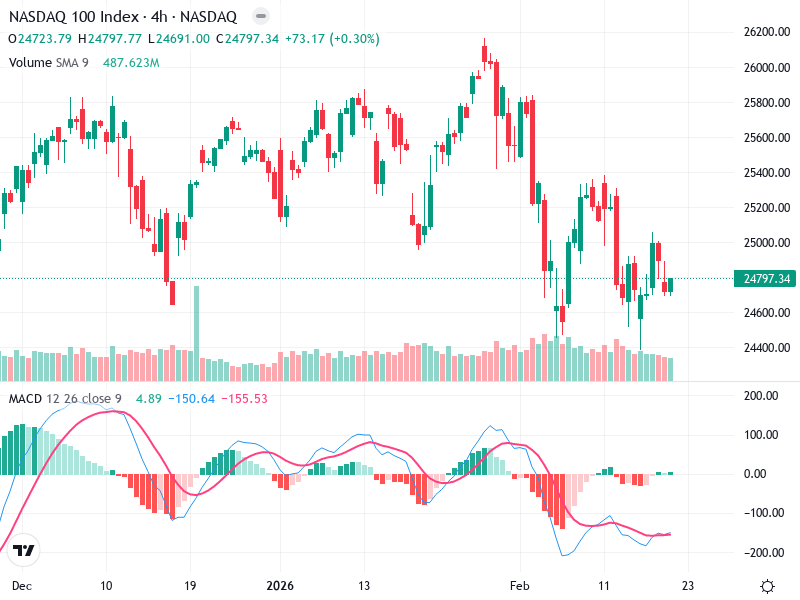
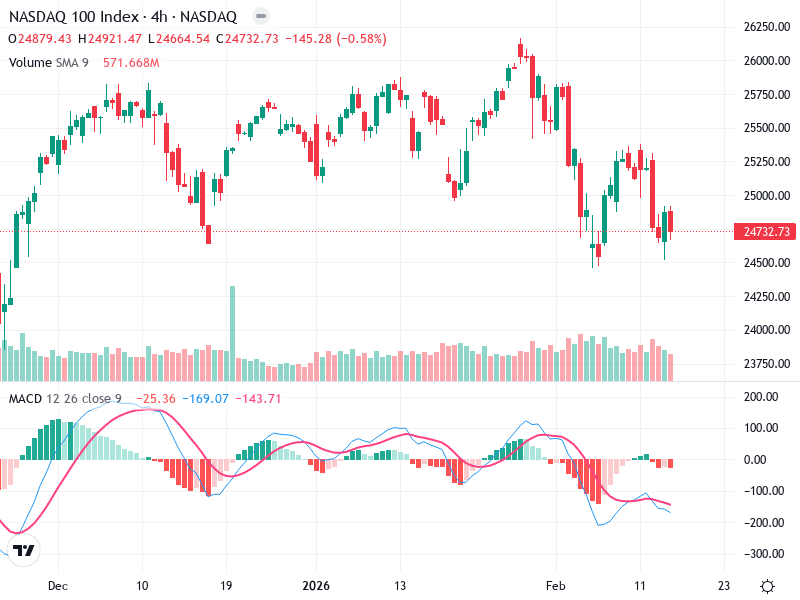
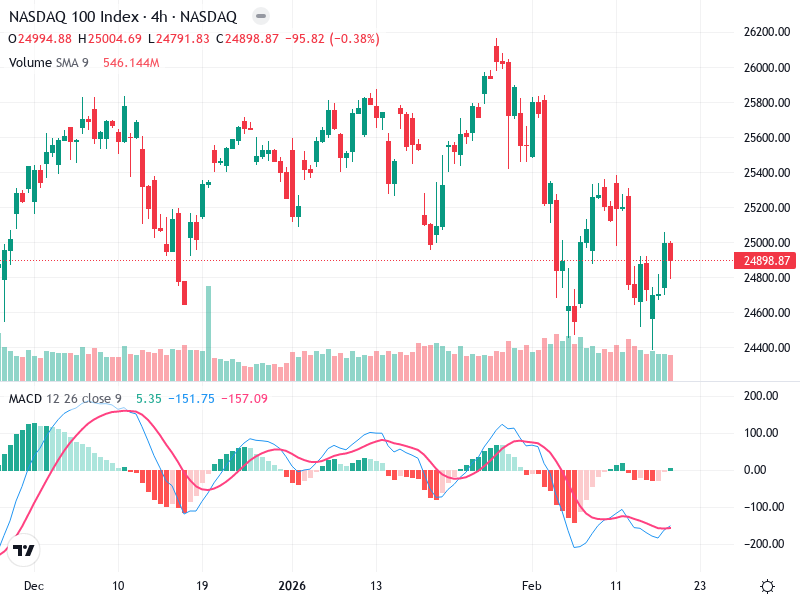
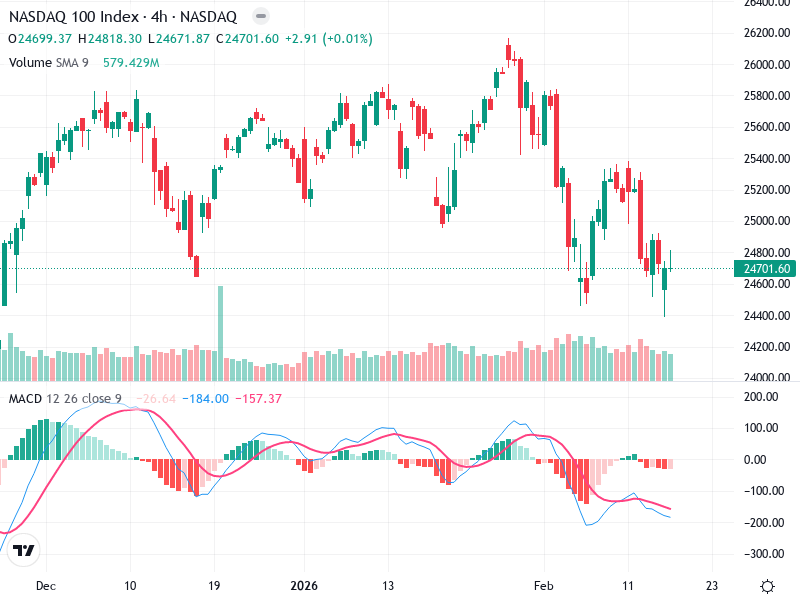
Around 24,500, this level is a potential zone for a bounce.

Recent attempts to break above 25,000 have failed, marking it a strong resistance level.

Breaking below the current support could trigger further downside, while surpassing resistance may lead to a bullish reversal.

Actionable Insights

Consider a hold or sell strategy until a stronger confirmation of reversal is observed. Short-term traders might look for opportunities to sell on rallies.

A bullish MACD crossover or increased buying volume might signal a potential reversal. Closely monitor the support at 24,500.

Overall sentiment leans bearish; however, a shorter-term consolidation could precede a potential reversal.

The AI Technical Analysis Center is an informational tool only and does not constitute investment or trading advice.
This site is registered on wpml.org as a development site. Switch to a production site key to remove this banner.