February 20, 2026 17:02
The analysis focuses on the asset’s price movement and key levels.
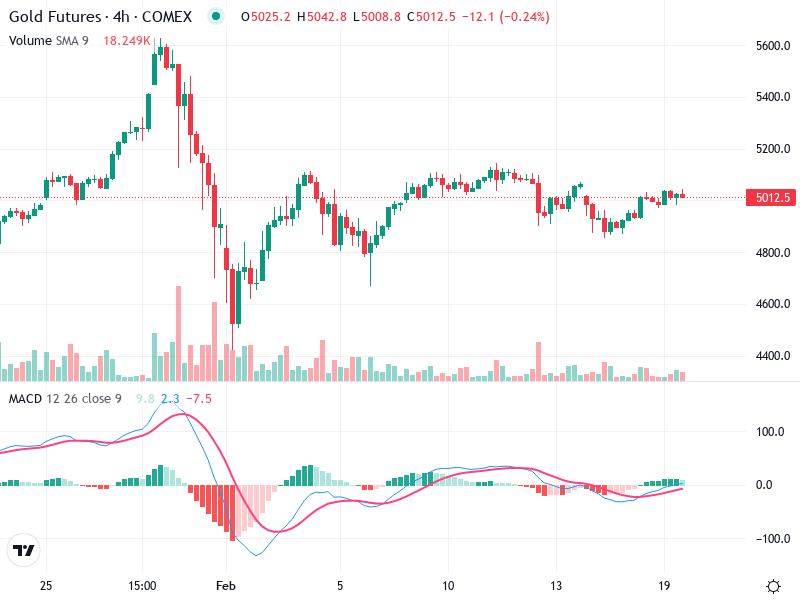
The asset is currently experiencing a consolidation phase after a sharp initial decline.
Key attention is on potential breakout or breakdown for future price direction.
The chart shows a sharp bearish move following a potential double top pattern in early January, followed by a recovery.
Recently, there is a sideways trend with small-bodied candles indicating consolidation.
The broader trend remains sideways to slightly bullish after the initial dip and recovery.
The MACD line is above the Signal line, indicating a recent bullish crossover.
The MACD histogram shows small bullish momentum, suggesting a lack of strong direction.
No clear divergences between MACD and price action, suggesting alignment between MACD and recent price behavior.
Volume spiked during the initial drop, likely indicating institutional activity.
Currently, volume is lower, consistent with the consolidation phase.
The decreasing volume supports the sideways movement, indicating reduced trading interest at current levels.
Key support at 4800, critical to maintain bullish sentiment.
Resistance at 5100, with a clear breakout above this level suggesting continued upward momentum.
Buy: On a confirmed breakout above 5100 with increased volume.
Sell: If the price falls below 4800, suggesting a potential retracement.
Hold: Current positions could be held unless a breakout or breakdown occurs.