February 13, 2026 17:03
Analyzing the current chart for Gold Futures reveals interesting points.
The asset has recently shown a bearish trend but shows signs of potential change.
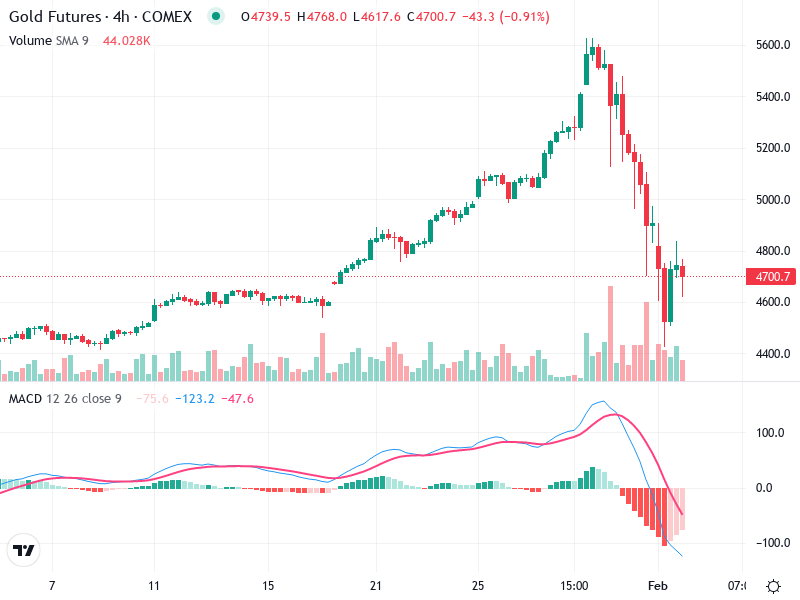
The chart shows a recent strong bearish trend, with a noticeable decline from around 5400 to the current level of 4700.
Several consecutive large red candles indicate strong selling pressure. A potential doji appears at the current price level, suggesting indecision.
A significant support level appears to have been tested near the 4600 mark, which held back further declines.
There's been a recent bearish crossover, where the MACD line crossed below the Signal line, indicating continued bearish momentum.
The histogram shows negative momentum but appears to be contracting, which may signal a slowdown in bearish momentum.
No clear divergences are observed currently between the MACD and price action.
There was a significant spike in volume accompanying the large downtrend, suggesting strong selling pressure, likely involving institutional investors.
The high volume on the decline supports the validity of the move.
Recent volume appears to decline along with potential consolidation, which can indicate uncertainty or a potential pause in the trend.
A key support level is around 4600, where the price previously bounced back.
Immediate resistance can be noted around the 4800-4900 region, where previous consolidation occurred.
These levels are crucial for monitoring future price movements.
Consider a cautious entry if the price breaks above the 4800 resistance level with strong volume, targeting the next resistance level.
Given the current bearish sentiment, selling on a break below the 4600 support with volume confirmation may be a prudent strategy.
Traders should hold off on any new positions until clearer confirmation occurs from either a breakout or a downturn.