Generic selectors
Exact matches only
Search in title
Search in content
Post Type Selectors

TOP SEARCHES

Stocks popular

Crypto

Currencies

CFD

Support

GOLD – Technical Analysis – 4h

December 1, 2025 17:02

Quick Summary

The chart for Gold Futures reflects a significant bullish trend in recent sessions. The asset has seen higher highs and lows, pointing to strong buying activity. Resistance and support levels should be monitored closely to anticipate any potential shifts.

Candlestick Analysis

The chart depicts a strong bullish trend evident from a series of higher highs and higher lows.

Recently, there's a formation resembling a bullish engulfing pattern before the current pullback, indicating strong buying interest.

The trend has been bullish, with a recent pullback suggesting a possible pause or consolidation phase.

MACD Analysis

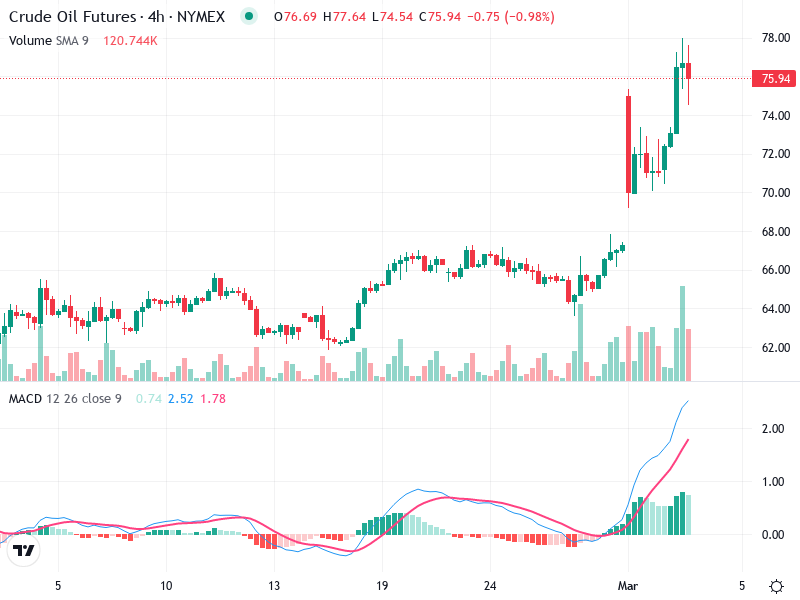
The MACD line is above the Signal line, indicating a recent bullish crossover, signaling upward momentum.

Positive bars on the MACD histogram confirm bullish momentum, though the recent smaller bars suggest weakening momentum as buying power decreases.

There are no significant divergences between the price and MACD to suggest reversals, maintaining the bullish outlook.

Volume Analysis

Volume has increased during upward movements, supporting the price rise.

However, recent volume appears slightly lower during the pullback, not indicating strong selling pressure.

No unusual spikes are evident, implying the movements align closely with normal trading patterns.

Support & Resistance

The support around 4160.0 is crucial, where previous consolidation occurred, providing a potential bounce point.

Near-term resistance is observed at 4280.0. A successful break above this could indicate further upside potential.

The area around 4280.0 is critical, serving as an initial resistance level during the previous peaks.

Actionable Insights

Consider buying on a confirmed breakout above 4280.0 with increased volume, suggesting continuation of the upward trend.

Watch for a significant drop below the 4160.0 support, which could trigger further downside.

Current holders should monitor for confirmation of trend continuation or reversal signals around key levels.

The AI Technical Analysis Center is an informational tool only and does not constitute investment or trading advice.
This site is registered on wpml.org as a development site. Switch to a production site key to remove this banner.