Generic selectors
Exact matches only
Search in title
Search in content
Post Type Selectors

TOP SEARCHES

Stocks popular

Crypto

Currencies

CFD

Support

GBP/USD – Technical Analysis – 4h

December 1, 2025 13:04

Quick Summary

The chart shows a clear upward momentum with the asset trending higher in recent sessions.

The asset’s price movement is characterized by significant bullish patterns, suggesting strong interest among buyers.

Candlestick Analysis

The chart exhibits a bullish trend from the bottom left to the top right.

There is a significant bullish candlestick pattern emerging, indicative of strong upward momentum. The recent price action shows a series of higher highs and higher lows.

A breakout above the resistance around 1.3250 has occurred, signaling potential further gains. Watch for sustained movement above this level.

MACD Analysis

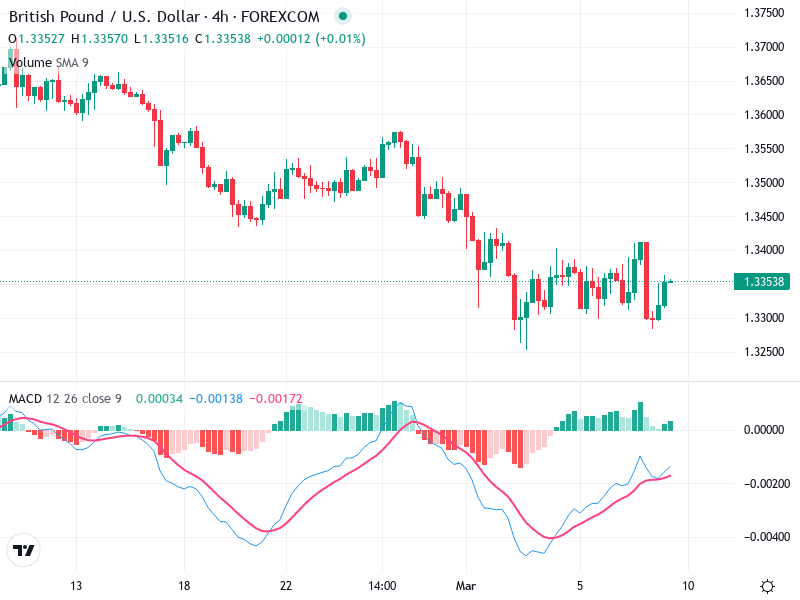
The MACD line is slightly below the Signal line, indicating a recent bearish crossover. This suggests a potential loss of momentum in the short term.

The histogram has recently shifted into negative territory, which could imply decreasing bullish momentum.

There is no clear divergence with the price action at this time, but vigilance is advised for any developing divergences.

Volume Analysis

Volume appears steady, though not particularly high during the recent uptick, suggesting some caution regarding the current upward movement's sustainability.

No significant volume spikes indicating institutional activity have been observed.

The current volume levels indicate regular trading activity without major influence from large investors.

Support & Resistance

The key resistance level was near 1.3250, which has recently been breached.

The immediate support is around the 1.3100 level, which coincides with previous consolidation areas.

Monitor these levels for potential breakout and pullback opportunities.

Actionable Insights

Consider buying if the price holds above the 1.3250 level, emphasizing the importance of confirmation with increased volume.

A pullback to the 1.3100 support without sustained buying may suggest a sell or short opportunity.

Keep an eye on the MACD for possible re-crossover to the bullish side as a confirmation signal for buying.

The AI Technical Analysis Center is an informational tool only and does not constitute investment or trading advice.
This site is registered on wpml.org as a development site. Switch to a production site key to remove this banner.