March 13, 2026 13:04
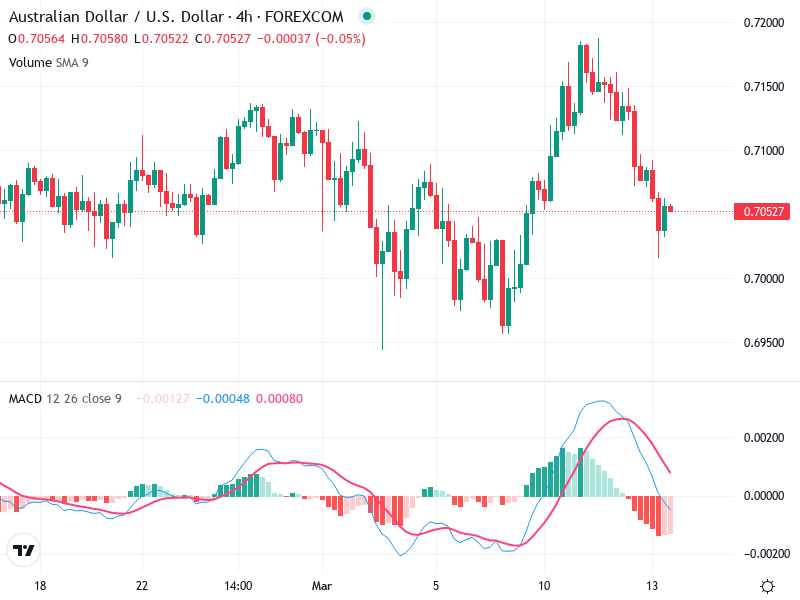
The AUD/USD 4-hour chart reflects a period of cautious market sentiment. Recent price movements indicate a potential consolidation phase as traders await clearer directional cues. Monitoring key support and resistance levels will be pivotal in predicting future trends.
The absence of a significant candlestick pattern such as a bullish engulfing or hammer is noted, but a long wick to the downside suggests buying interest near support.
The broader context reveals a sideways to mildly bullish trend with short-term bearish pressure.
The price is currently testing a support zone near the 0.7060 level, indicating potential for further downside if broken.
The MACD line currently sits below the Signal line, highlighting bearish momentum.
The MACD histogram remains in negative territory, reinforcing this bearish trend.
No clear divergences between the MACD and price action have been identified.
An increase in trading volume during recent price declines indicates bearish confirmation.
Elevated selling pressure is suggested by the increased volume alongside the price drop.
Despite high volumes, no distinctive spikes indicate potential institutional activity.
The key support region, ranging from 0.7050 to 0.7060, is critical as a breach could lead to further declines.
Key resistance is identified around 0.7100, where previous upward moves were resisted.
These levels are crucial for determining whether the trend reverses or continues.
Consider long entries if a reversal at current support is confirmed with bullish signals like a candlestick pattern or MACD crossover.
Shorting opportunities may arise if the price breaks below the 0.7050 support with increased volume.
If movement remains uncertain near support, it might be wise to hold off on trades until a clearer signal appears.