February 13, 2026 13:04
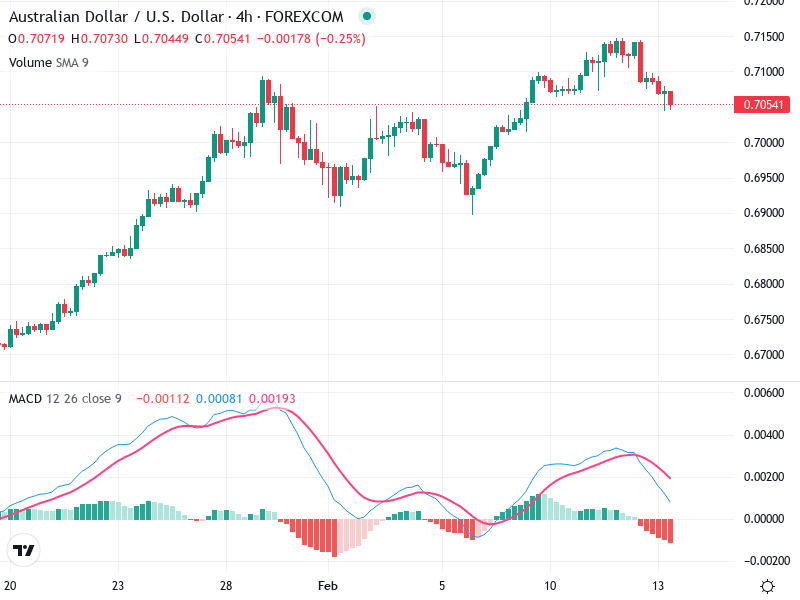
The chart for the Australian Dollar / U.S. Dollar (AUD/USD) on a 4-hour timeframe reveals key insights into its recent price movements. It demonstrates a transition from a prior strong uptrend to a current short-term downtrend. Attention to support and resistance levels is crucial for potential trading strategies.
The chart reveals a strong previous uptrend that peaked and has reversed into a short-term downtrend.
Recent candlestick formations highlight a bearish sentiment with elongated bearish candles, indicating continued selling pressure.
A possible bullish hammer at the low point suggests potential support and a reversal, contingent on future confirmations.
The MACD line is positioned below the Signal line, which underlines bearish momentum.
A recent bearish crossover suggests the likelihood of a continued downward trend.
The MACD histogram remains in negative territory and is expanding, reinforcing the bearish sentiment with strengthening momentum.
Volume remains relatively stable, with no significant spikes, which could indicate a lack of strong conviction in the current downtrend.
There is no notable volume change reflecting institutional activity, suggesting that the recent move lacks robust confirmation.
The current volume configuration implies cautious sentiment within the market.
Support is anticipated around the recent low close to the 0.6900 level, as seen in the hammer candlestick pattern.
Resistance is likely near the 0.7000 level, previously acting as a breakout failure point and a psychological barrier.
Monitoring these key levels is essential for strategizing future trades.
Consider buying if there is confirmed support at 0.6900, marked by bullish signals such as increased volume or specific candlestick patterns.
The current momentum suggests selling rallies near resistance around 0.7000, unless bullish indicators emerge.
If a short position is already held, maintaining it might be prudent until decisive bullish signs appear.