Generic selectors
Exact matches only
Search in title
Search in content
Post Type Selectors

TOP SEARCHES

Stocks popular

Crypto

Currencies

CFD

Support

BTC/USD – Technical Analysis – 4h

February 13, 2026 08:05

Quick Summary

The chart exhibits a bearish trend in late January which transitions into a period of consolidation with sideways movement early in February.

A potential bullish engulfing pattern around February 4th indicates a possible reversal from the downtrend.

The asset is facing strong resistance at 72,000, which has not been broken, keeping the price in check.

Candlestick Analysis

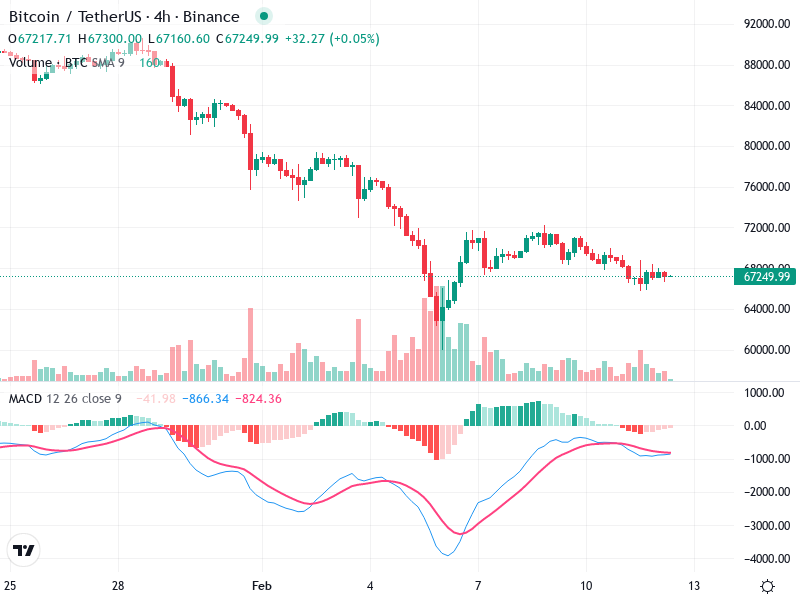
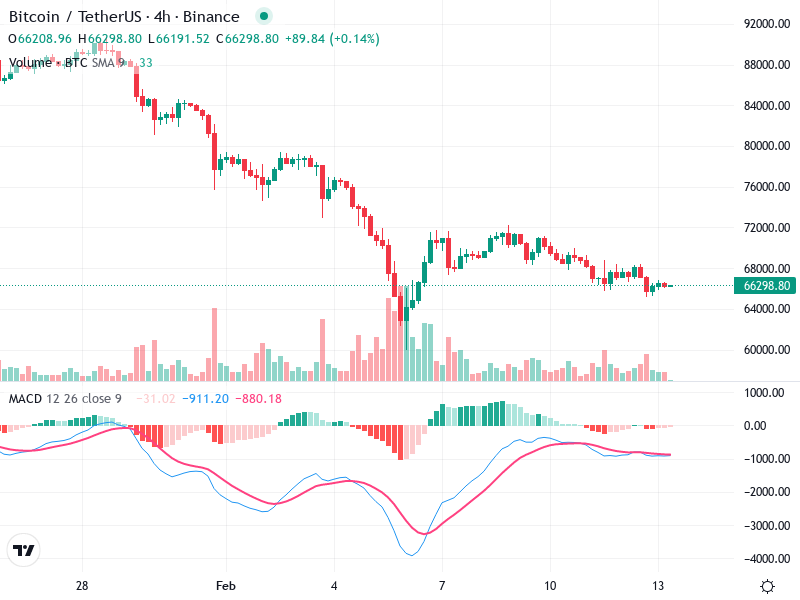
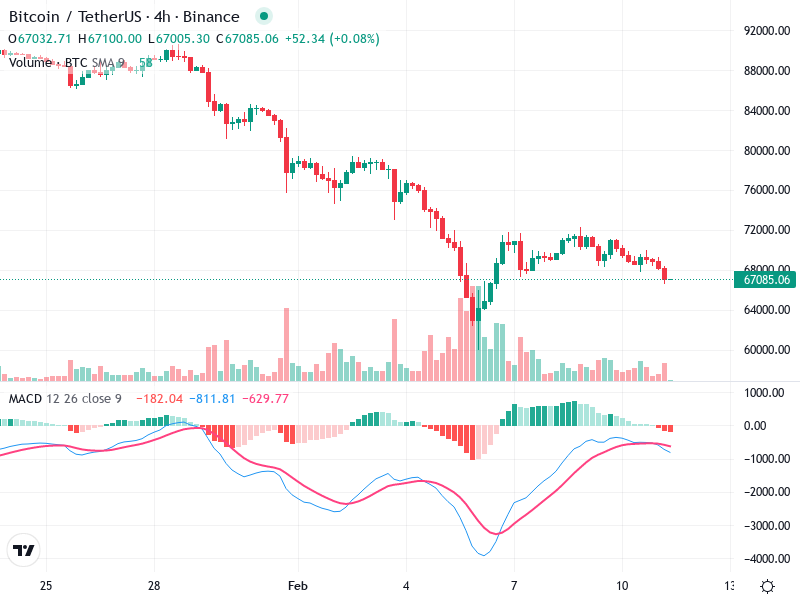
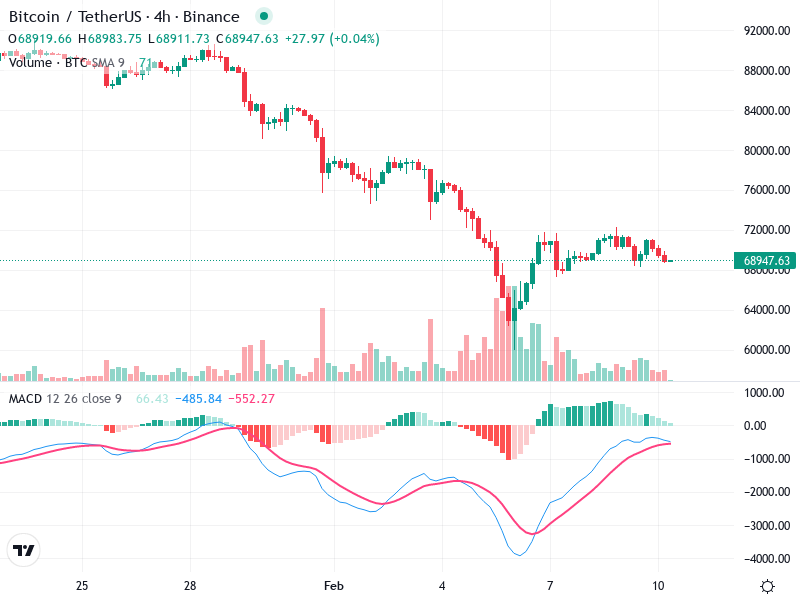
The chart shows a bearish trend towards the end of January, followed by consolidation in early February.

Noticeably, a potential bullish engulfing pattern appeared around February 4th, hinting at a reversal.

Evidently, there is a breakout zone near 72,000 that was approached but not successfully breached.

MACD Analysis

The MACD line crossed above the Signal line around February 6th, indicating a bullish crossover.

However, it is now converging closely again, suggesting weakening momentum.

No clear MACD divergence with price action is observed at present.

Volume Analysis

A spike in volume during early February corresponds with the bullish move, indicating initial buying interest.

Recent lower volume supports the consolidation phase, showing a lack of strong buying or selling interests.

High volume from February 3rd to 5th suggests potential institutional buying or significant trader interest.

Support & Resistance

The key support level is around 64,000, tested during the consolidation phase.

Notably, there is strong resistance at 72,000, acting as a barrier for bullish attempts.

These levels are critical in determining the asset's future price action.

Actionable Insights

Consider buying if the price approaches support near 64,000, with signs of higher lows indicating accumulation.

Current sell signals are weak unless a break below 64,000 occurs, suggesting further drop potential.

Holding is advised during this consolidation phase unless breakout cues become evident.

The AI Technical Analysis Center is an informational tool only and does not constitute investment or trading advice.
This site is registered on wpml.org as a development site. Switch to a production site key to remove this banner.