Generic selectors
Exact matches only
Search in title
Search in content
Post Type Selectors

TOP SEARCHES

Stocks popular

Crypto

Currencies

CFD

Support

BTC/USD – Technical Analysis – 4h

February 11, 2026 08:05

Quick Summary

The analysis of the asset chart indicates a predominantly bearish trend transitioning into sideways movement. Recent price consolidation after a drop suggests market indecision. The asset is displaying mixed signals as traders await clearer indications for future direction.

Candlestick Analysis

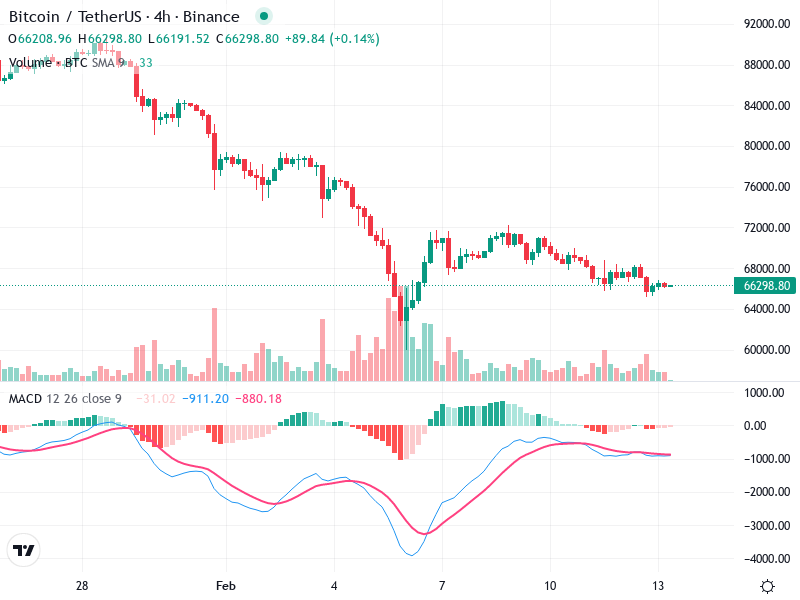
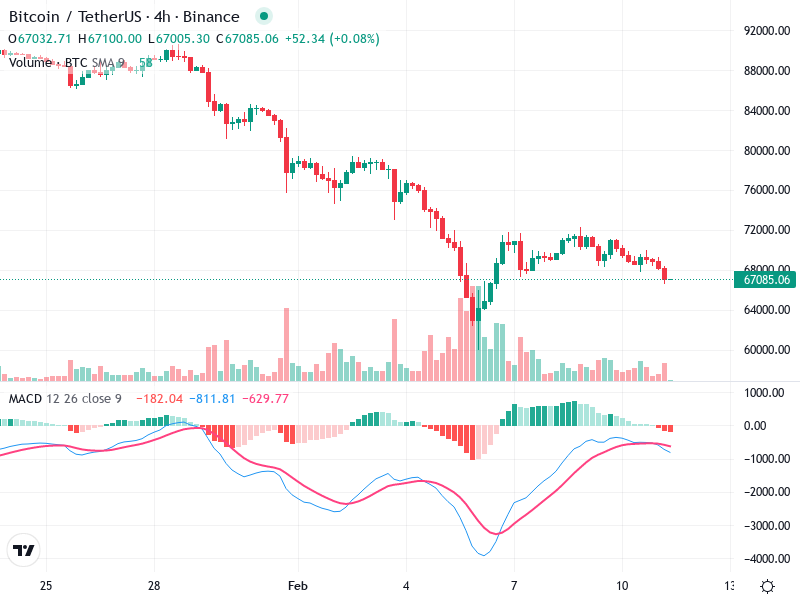
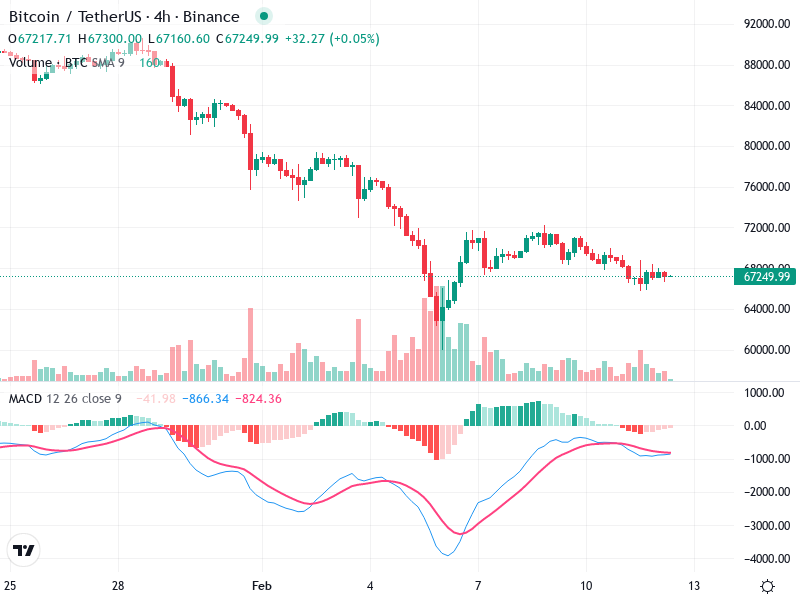
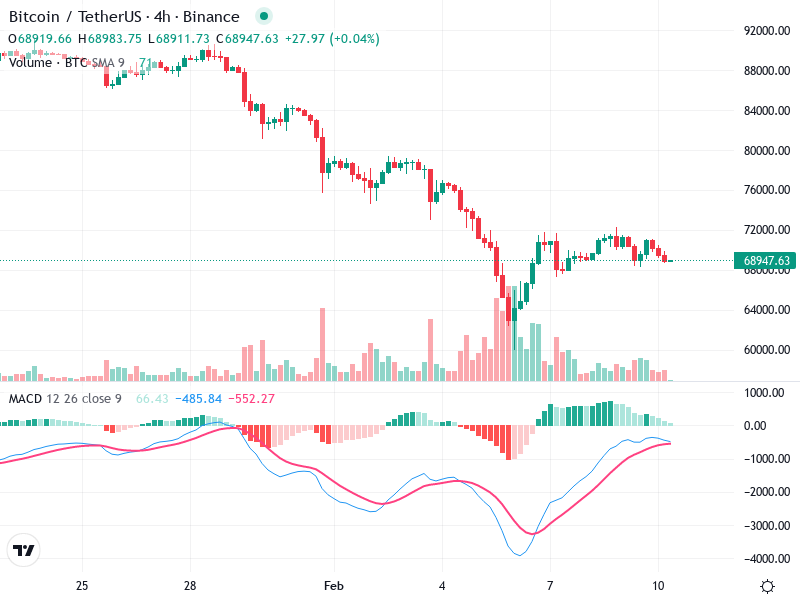
The chart shows a predominantly bearish trend leading into sideways movement. The price is currently consolidating after a drop, indicating indecision in the market.

There are no clear bullish reversal patterns such as hammers or morning stars, suggesting hesitation in a reversal. However, some smaller bullish candles indicate attempts to stabilize.

No clear breakout or pullback zones identified due to the current sideways movement.

MACD Analysis

The MACD line is currently above the Signal line after a bullish crossover, indicating a potential shift from bearish momentum.

The histogram shows declining positive momentum, which could indicate weakening bullish strength.

No significant divergence between MACD and price action is noticeable, aligning momentum with price movement.

Volume Analysis

There's a noticeable increase in volume during the recent sell-off, indicating strong selling pressure. Subsequent lower volumes suggest decreased selling intensity as the price consolidates.

No major institutional activity is apparent from the current volume spikes.

Volume analysis is consistent with the consolidation phase, showing reduced trading activity.

Support & Resistance

The area around 66,500 appears to be acting as a support level as the price has consolidated here.

The nearest resistance appears to be around 72,000, where prior consolidation occurred.

Support and resistance levels provide key markers for potential breakout and breakdown scenarios.

Actionable Insights

A conservative approach would be to wait for a breakout above 72,000 or a breakdown below 66,500 for clearer directional bias.

Watch for confirmations of breakout or breakdown with volume support to signify strong commitment from traders.

The sideways movement could lead to false breakouts given the consolidation state, demanding cautious monitoring.

The AI Technical Analysis Center is an informational tool only and does not constitute investment or trading advice.
This site is registered on wpml.org as a development site. Switch to a production site key to remove this banner.